Site Explorer 2.0
How to use the Overview 2.0 report
Overview 2.0 shows you how well any domain, URL, subdomain, or subfolder is performing in organic and paid search, plus high-level SEO and backlink metrics.

To select your preferred target mode, use the dropdown mode.
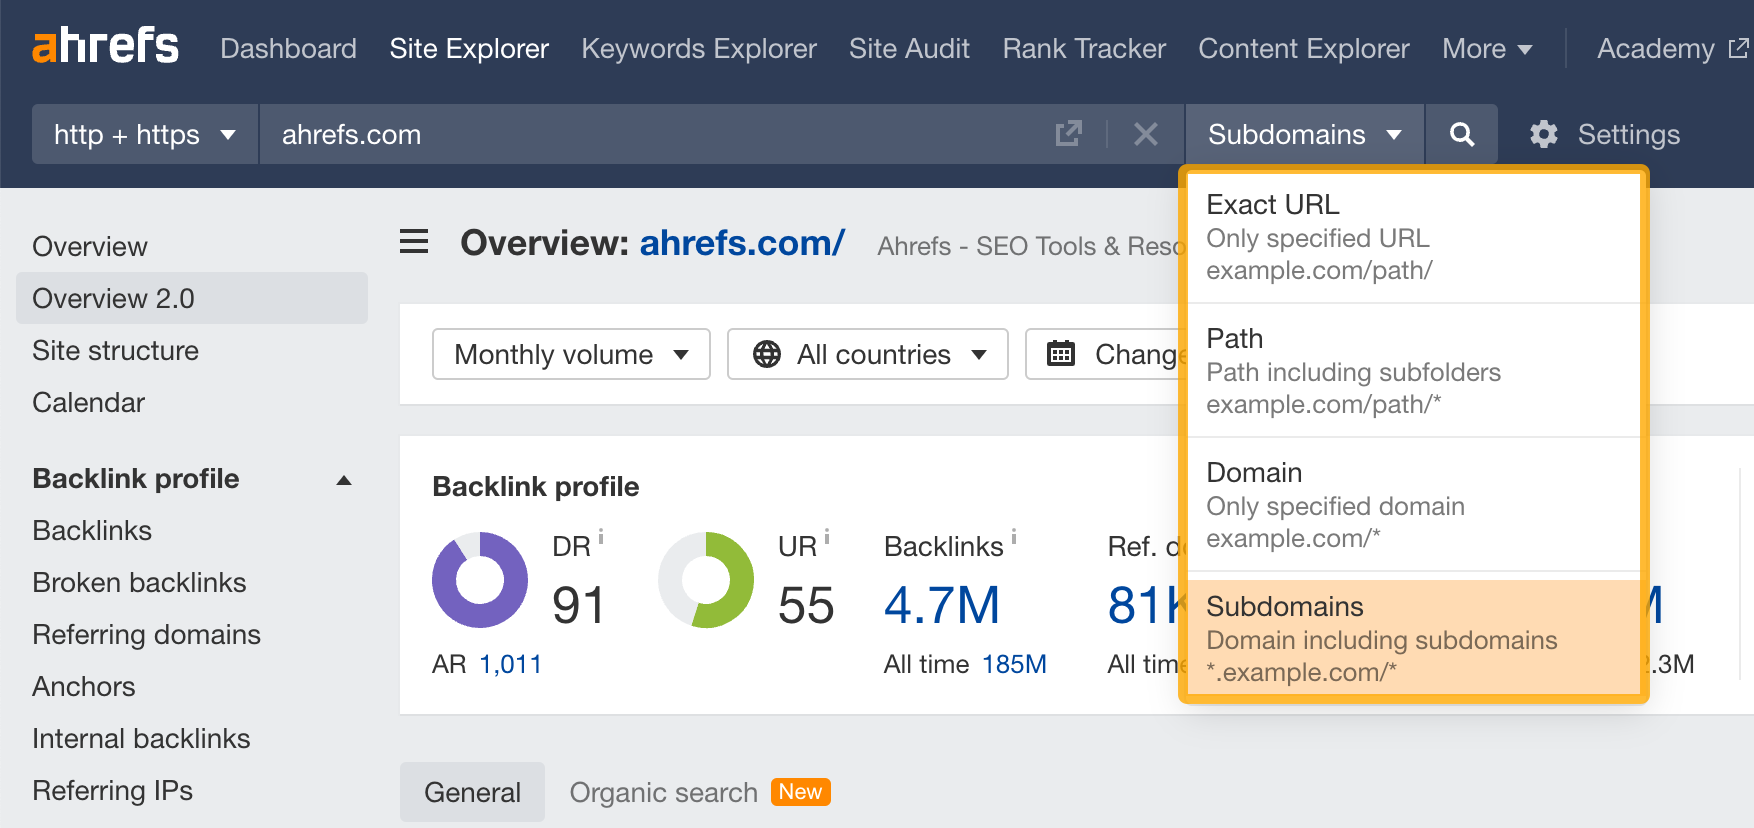
Here are some actionable use cases.
Overview 2.0 is more accurate and updated more frequently than Overview 1.0. It almost always shows fewer backlinks, referring domains, and organic keywords by design.
That’s because Overview 2.0:
- Automatically filters out backlinks that have not been recrawled for more than 6 months.
- Only counts unique organic keywords. It will only report the best URL of the selected domain for each keyword (if there are many URLs ranking for the same keywords).
See how much search traffic your competitors get
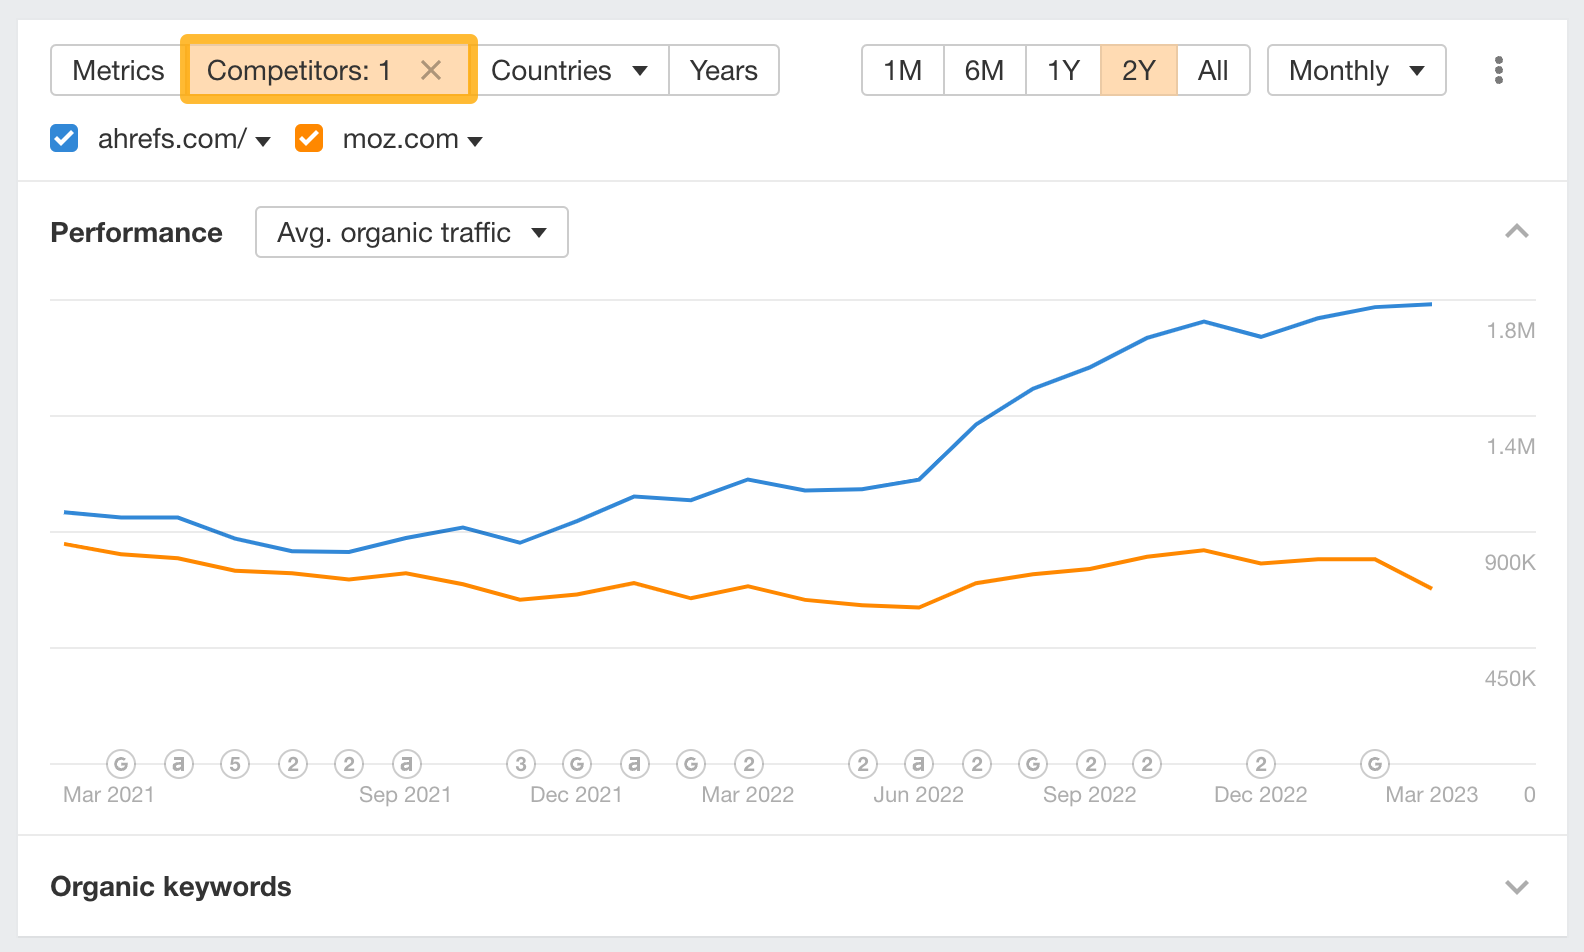
Compare your estimated search traffic with up to 10 competitors. Find out whether it’s increasing or decreasing over time and how you’re faring up against it.
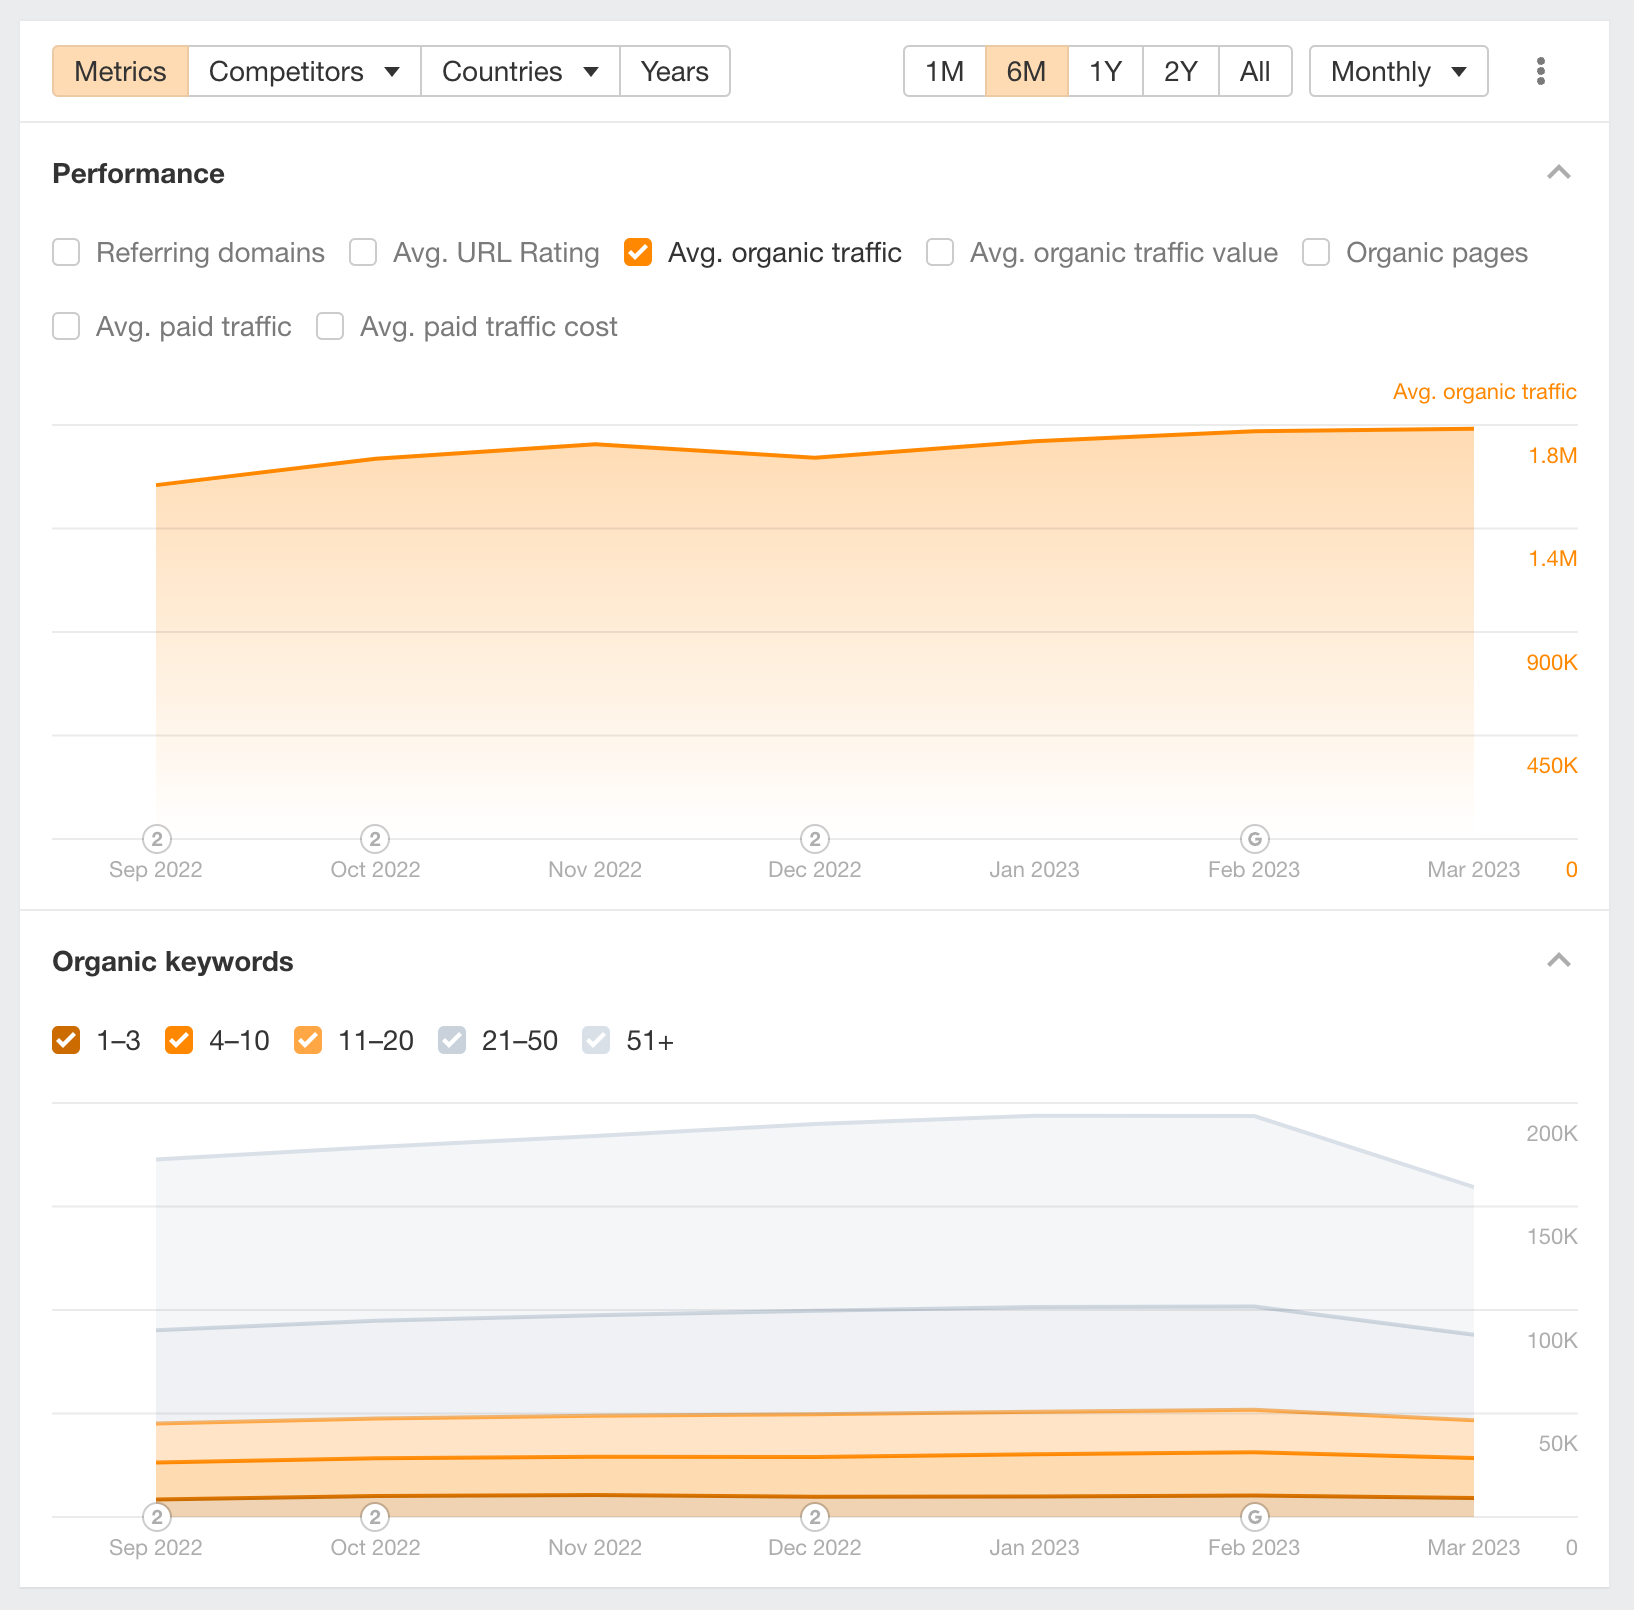
You can even go one step further and expand the Organic keywords by top position chart to delve deeper into the historical rankings of the Top 100 organic keywords.
If the target is ranking for an increasing number of organic keywords, the organic traffic graph should also follow a similar trend.
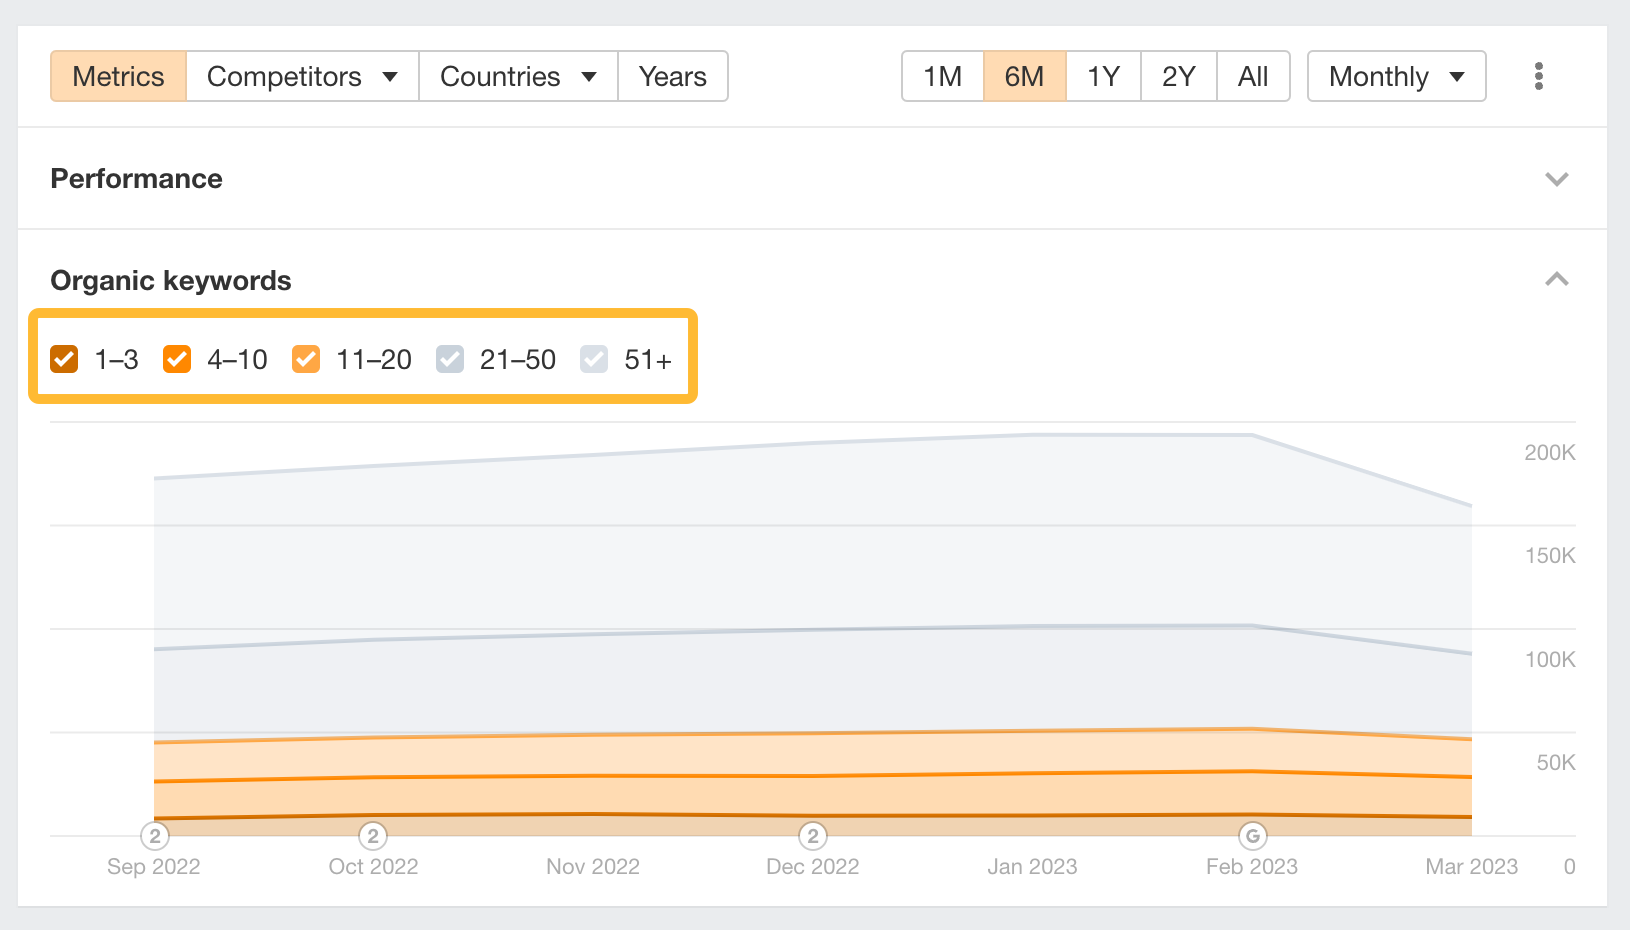
Don’t forget to check the position buckets to filter for keywords ranking in a specific position group (1-3, 4-10, 11-20, 21-50, 51+).
Filter only for keywords in the 4-10 bucket. Analyze what you're missing and see how you can move into the top 3 positions.
Track yearly trends with ease
Switch to the Years tab to visualize how your target website has performed year-on-year in terms of traffic, backlinks, and indexed pages.
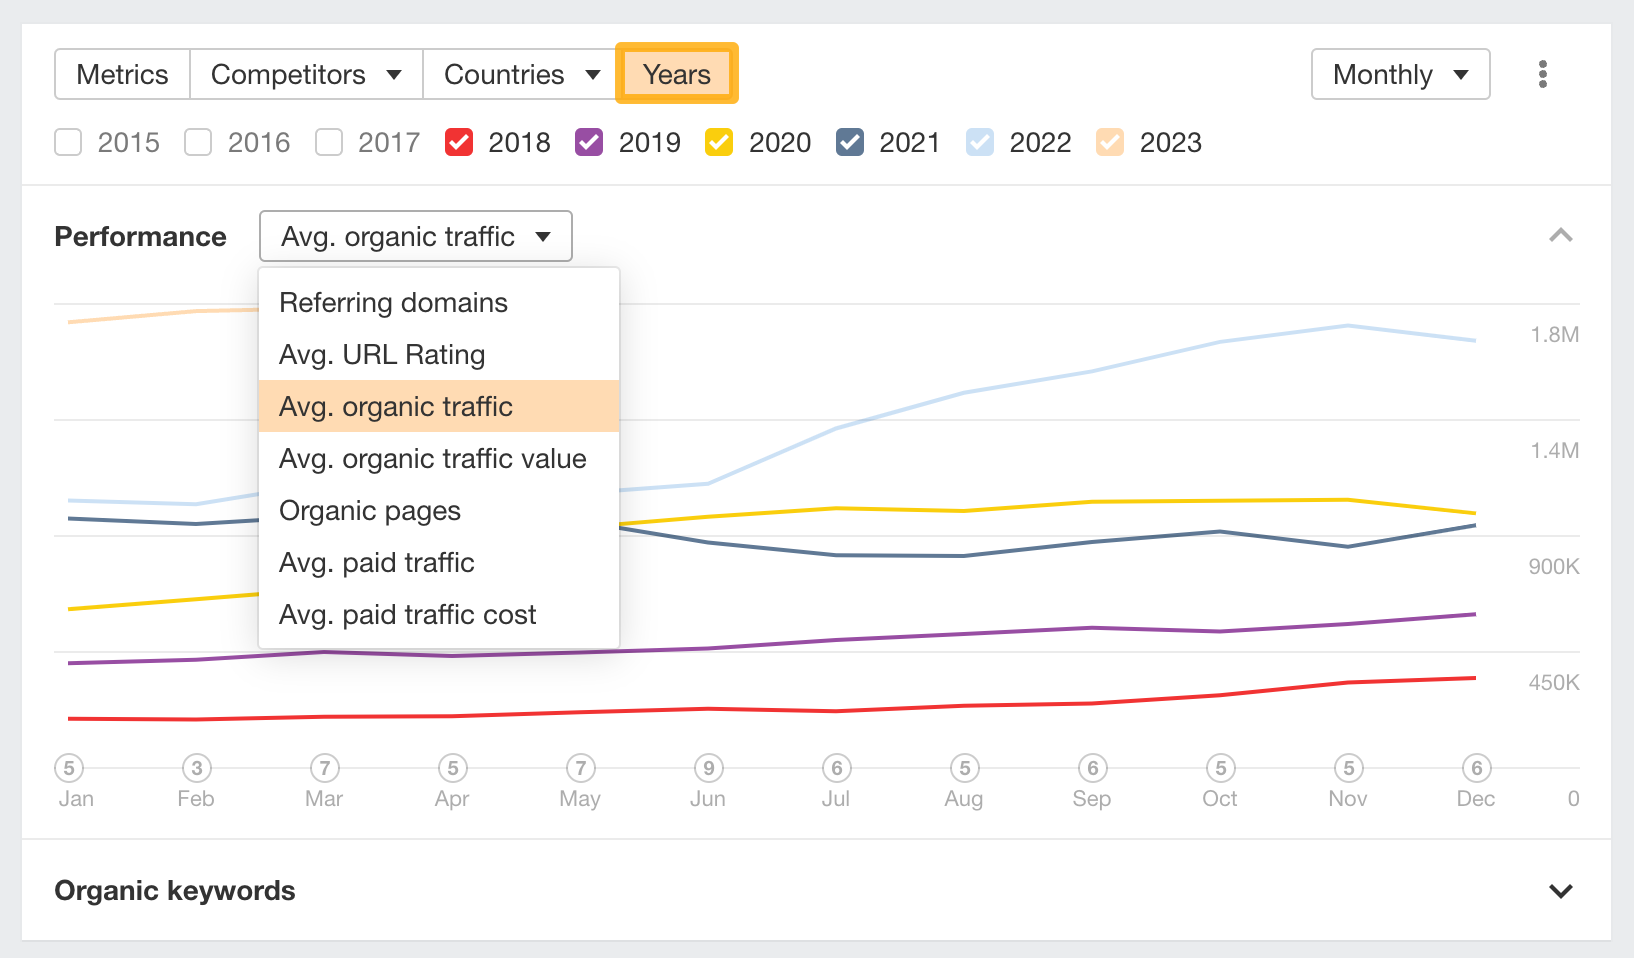
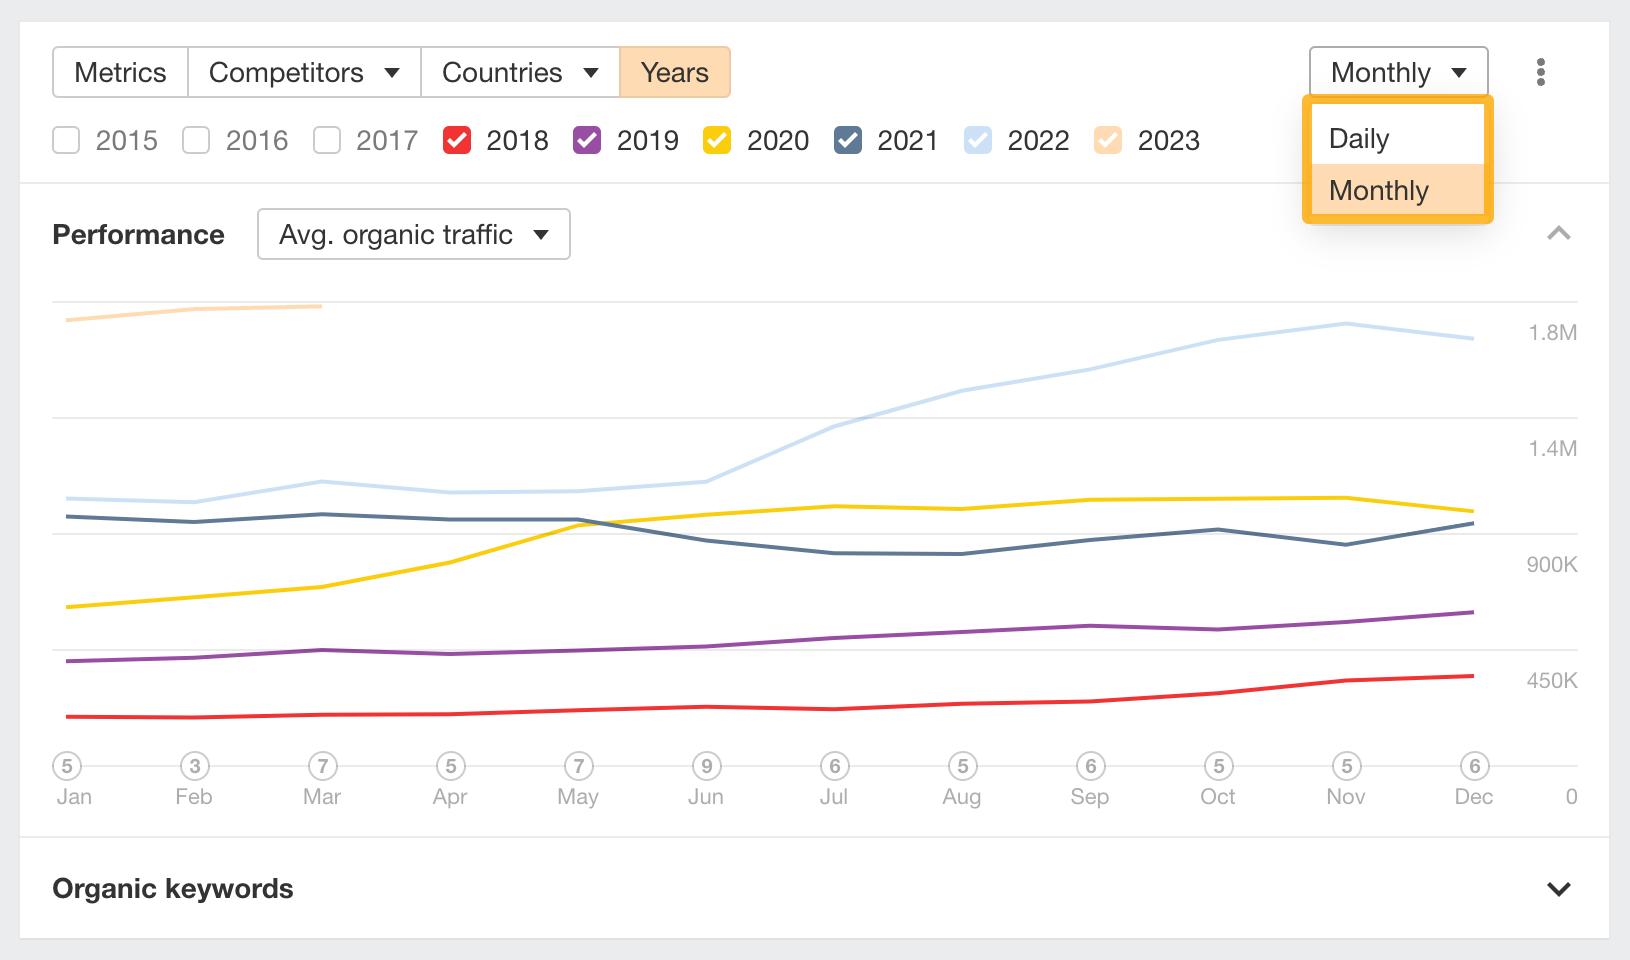
If you have monthly volume selected, the chart incorporates trend data into the traffic estimates. So any seasonal changes become easy to spot.
Track changes in organic traffic with Google updates
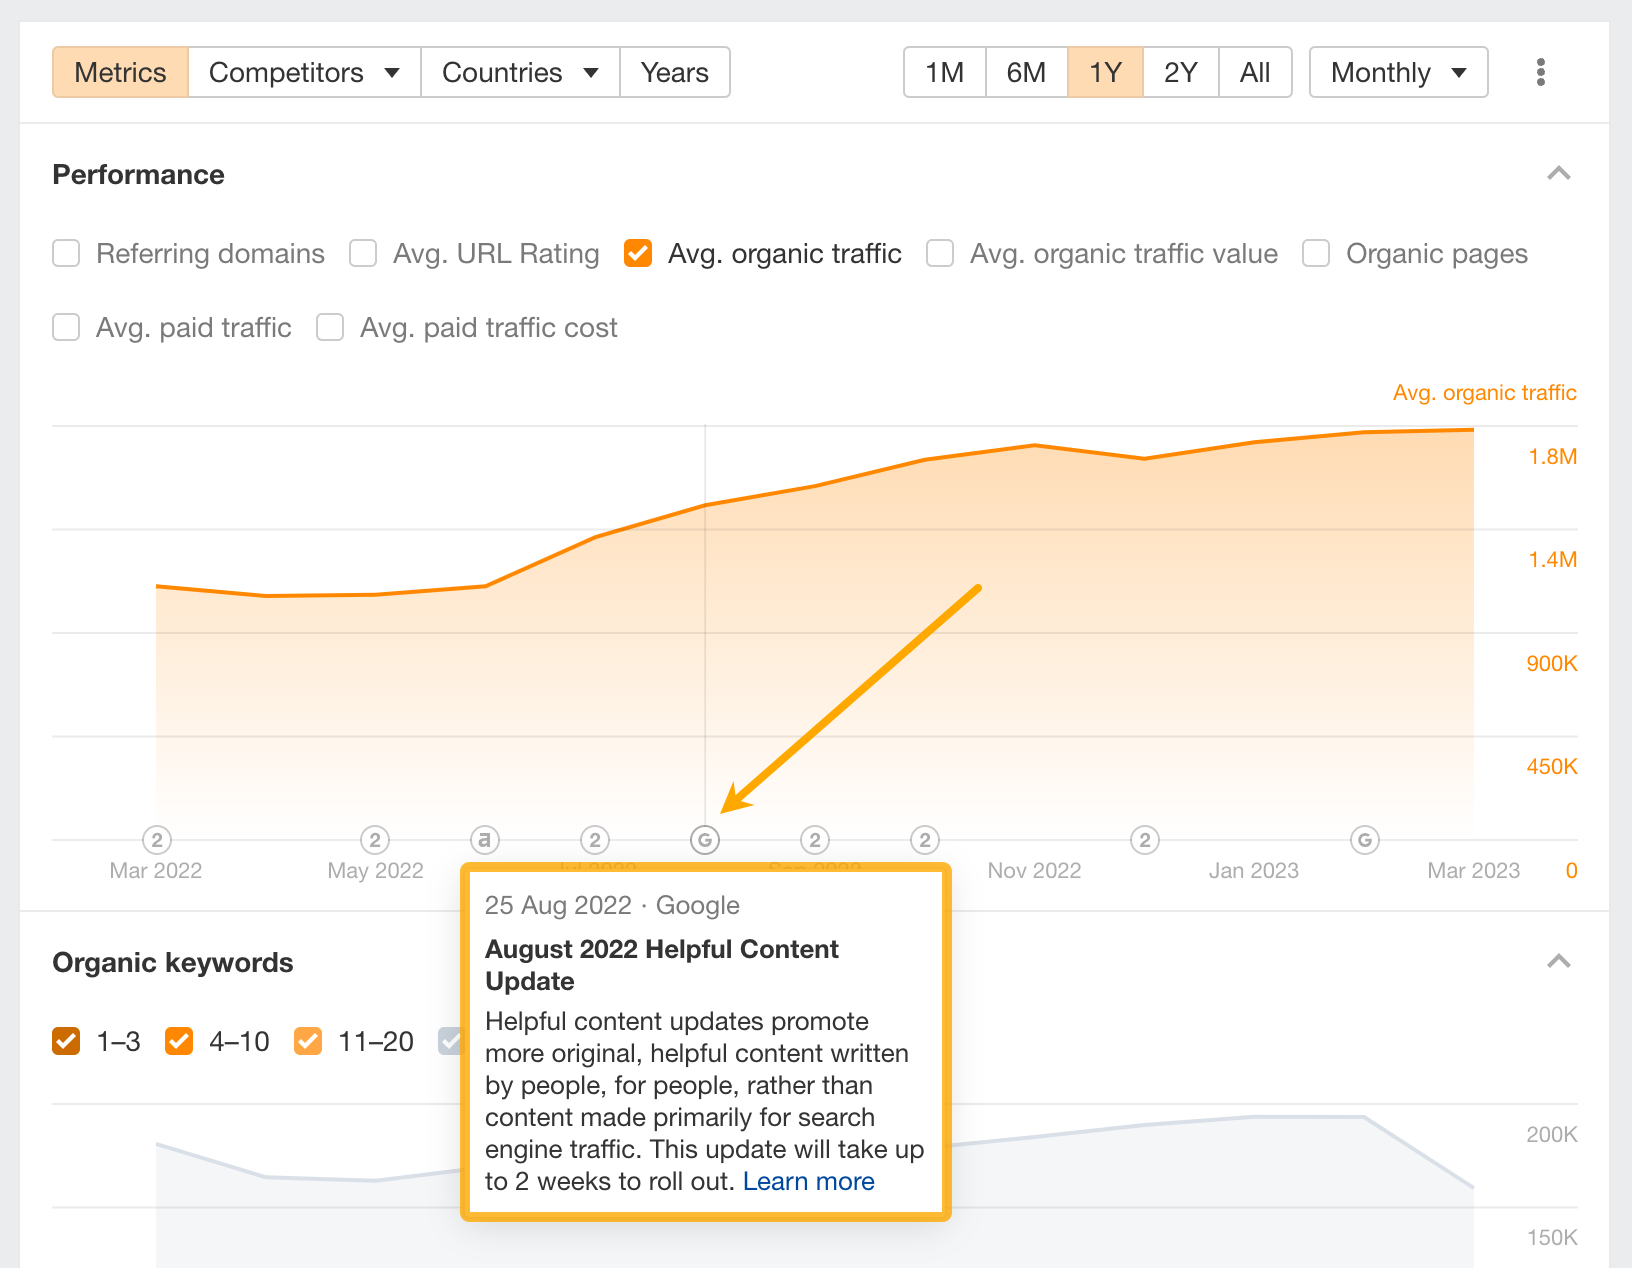
Cross-reference changes in organic traffic against Google updates.
Just hover over the chart notes at the bottom of the history chart to see Google algorithm updates for specific dates.
If your website is experiencing a decline in traffic due to a Google update, you can click Learn more to find out Google's recommendations on how to improve/recover your traffic.
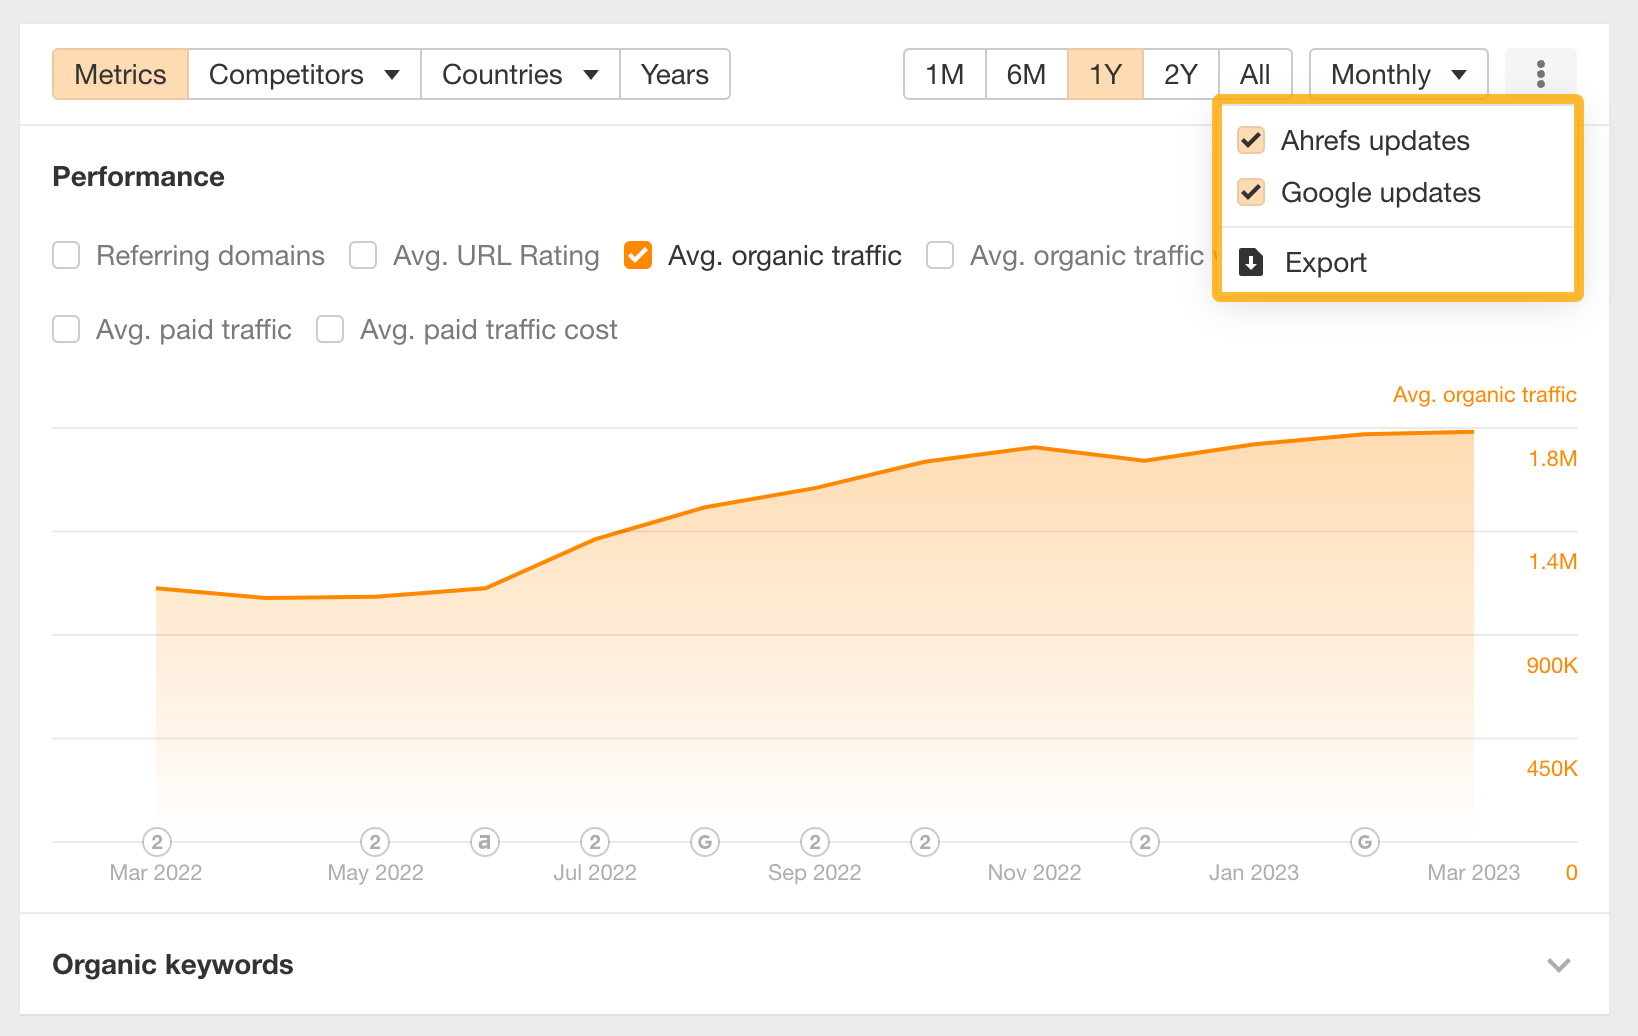
We’ve also marked our own keyword database updates, since these might influence the chart as well.
To toggle chart notes on and off, click on the chart settings icon.
Learn which pages bring search traffic to your competitors
Monitor the traffic share by country (%) for the current month, both for organic and paid search, in the tab with the same name.
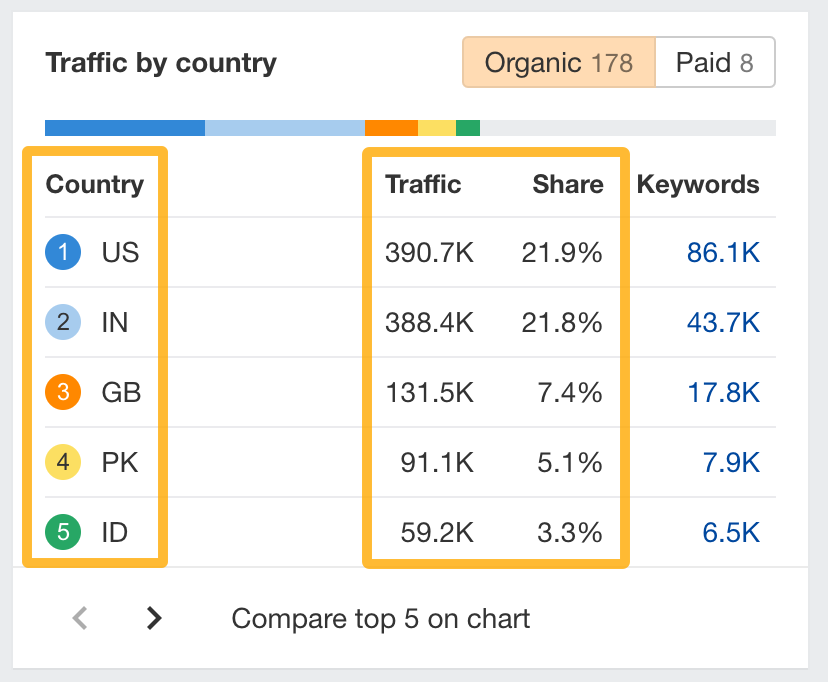
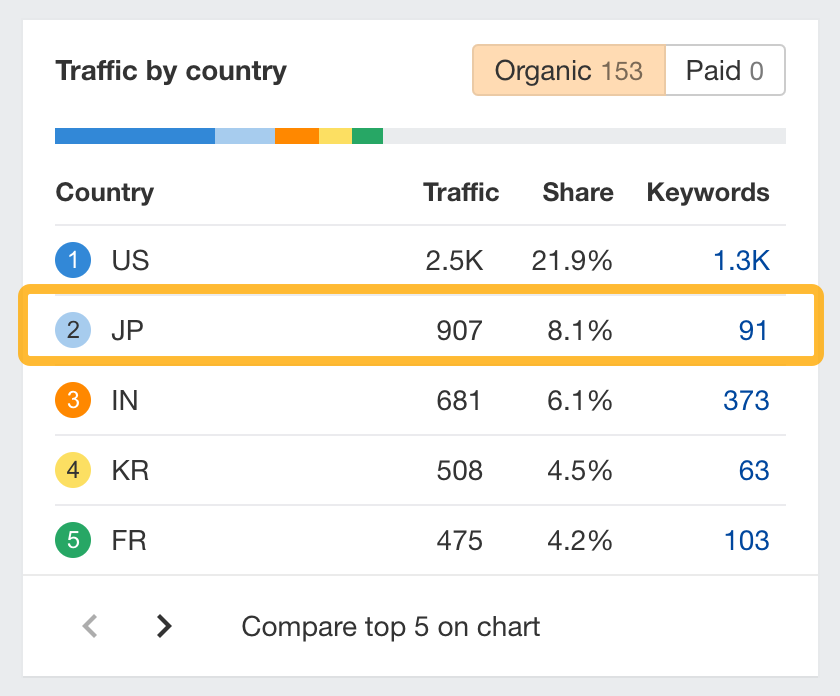
When analyzing a competitor’s traffic share by country, do your research and look out for unconventional patterns. You might be targeting US customers, but discover that an equal part of traffic comes from Japan.
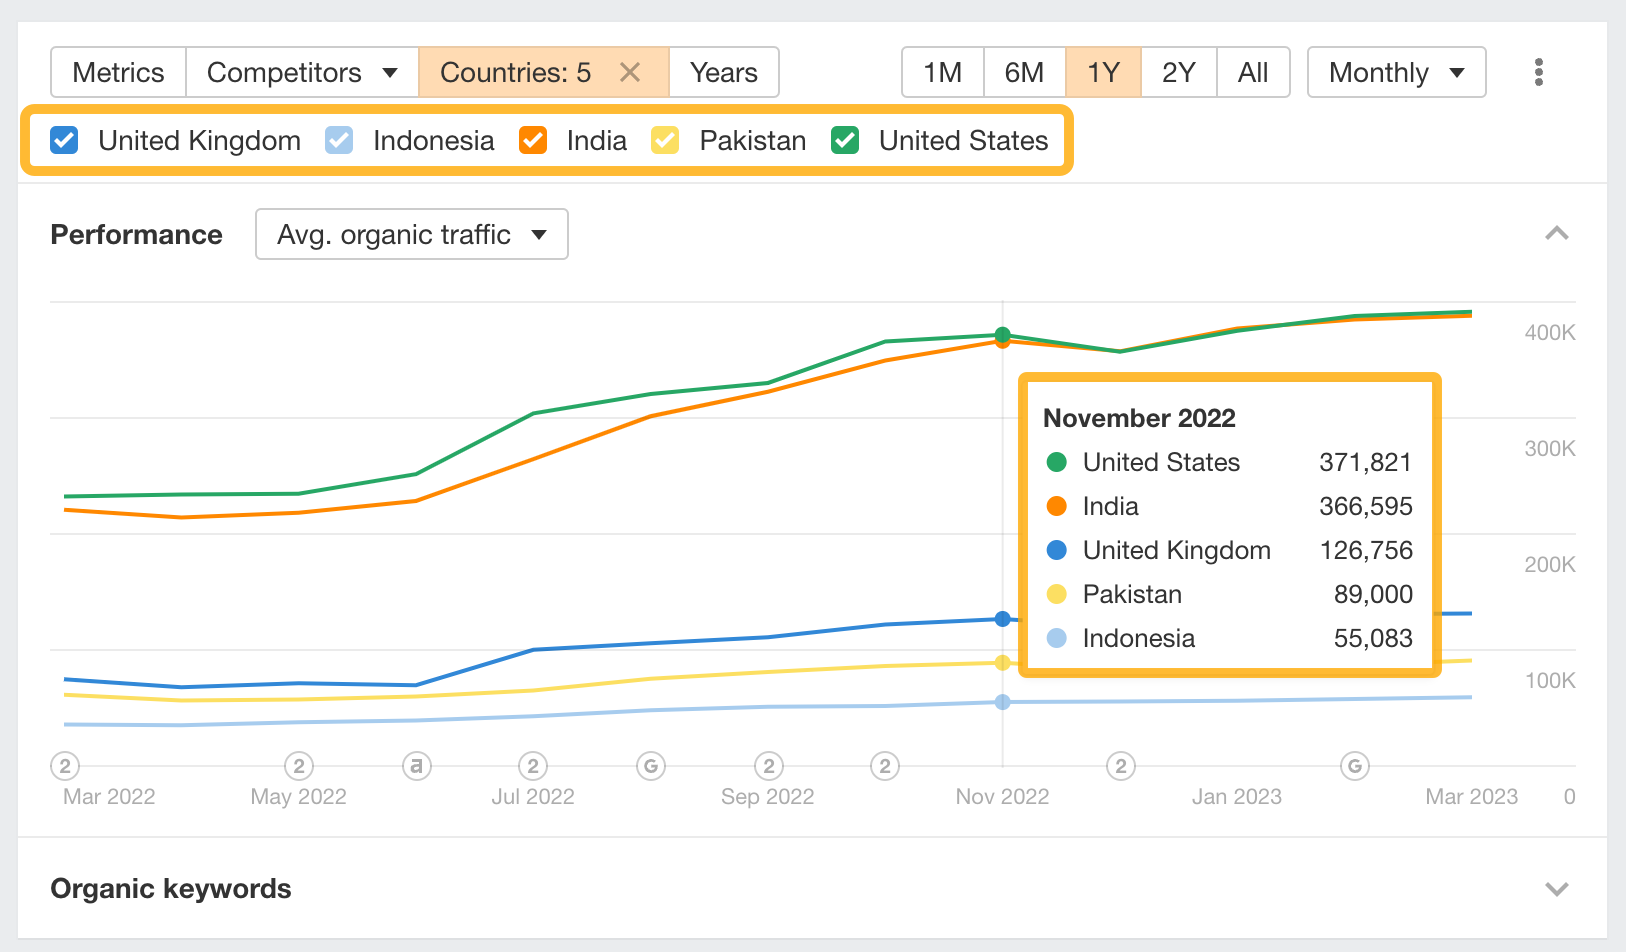
To better visualize performance over time, compare the Top 5 countries on the history chart. You’ll get a clear idea about your audience and how to prioritize your SEO efforts.
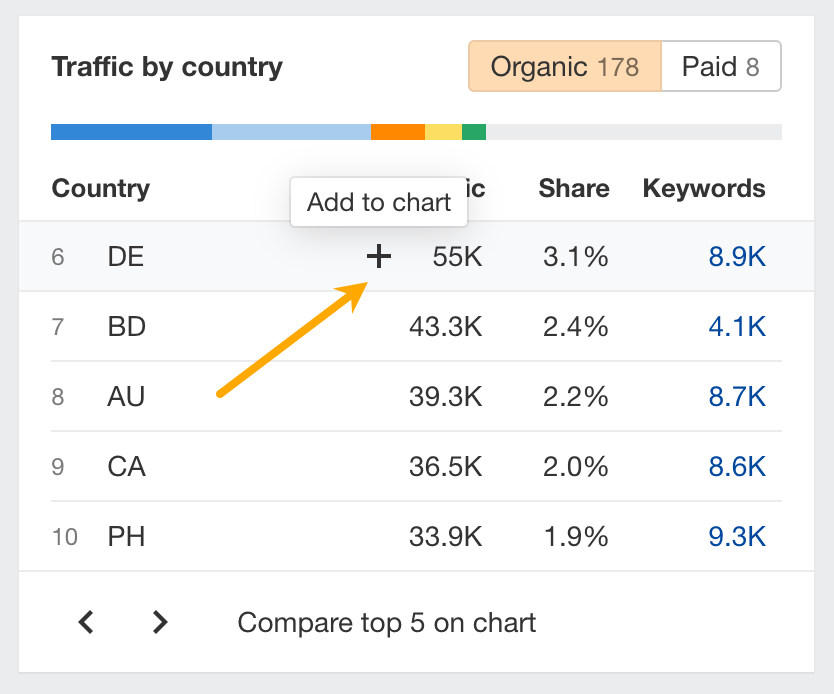
To add a country to the history chart, hover the “+” icon right next to the Traffic column.
Learn which pages bring search traffic to your competitors
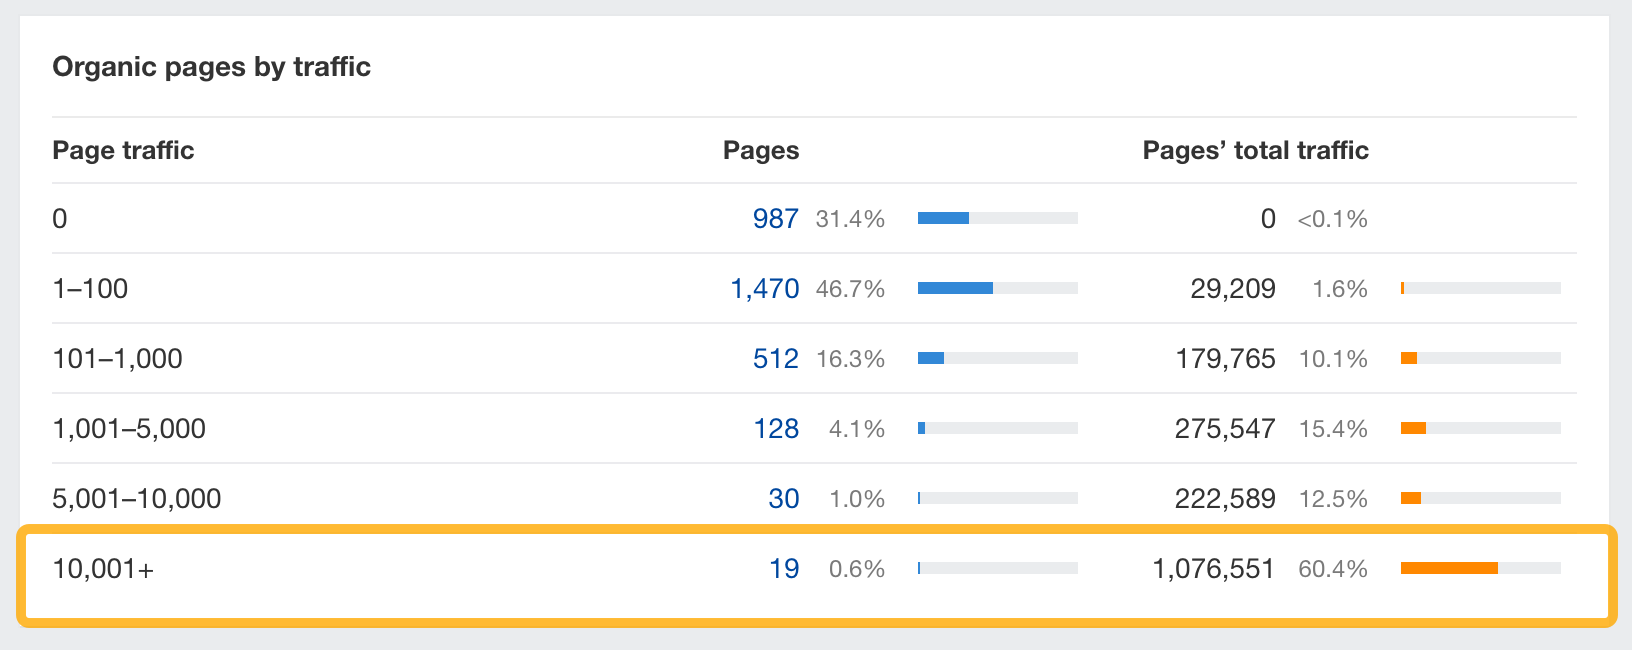
Check the Organic pages by traffic tab to see which of your competitor’s pages bring in the most search traffic. They could potentially be topics you'd want to cover too.
For example, just 19 pages of our website (0,6%) drive more than a million search visits, contributing 60% of the total estimated search traffic.
See if and how your competitors are investing in paid search
Overview 2.0 also features two sections targeted at paid search.
- Paid keywords shows the number of keywords your competitor is bidding on right now, along with the ads that they’re running for these keywords. Find new keywords that you might have been missing and get inspired by their ads.
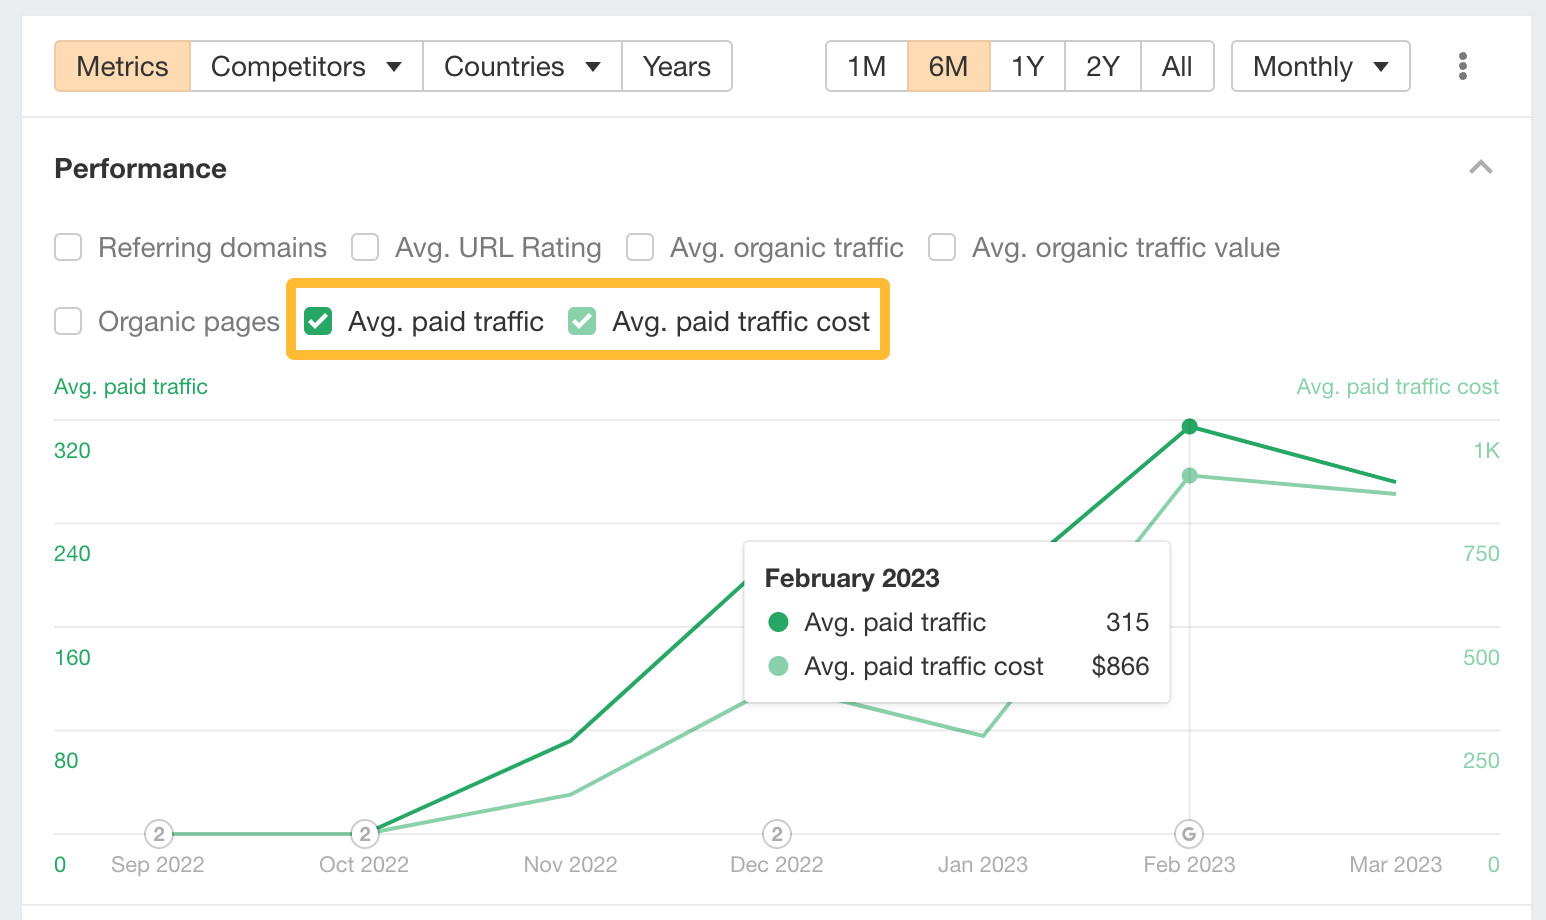
- Paid traffic shows the amount of traffic your competitor is receiving from paid search and their ad cost.

You can delve deeper into paid traffic by looking at the history chart.
Uncover your competitor’s backlink profile
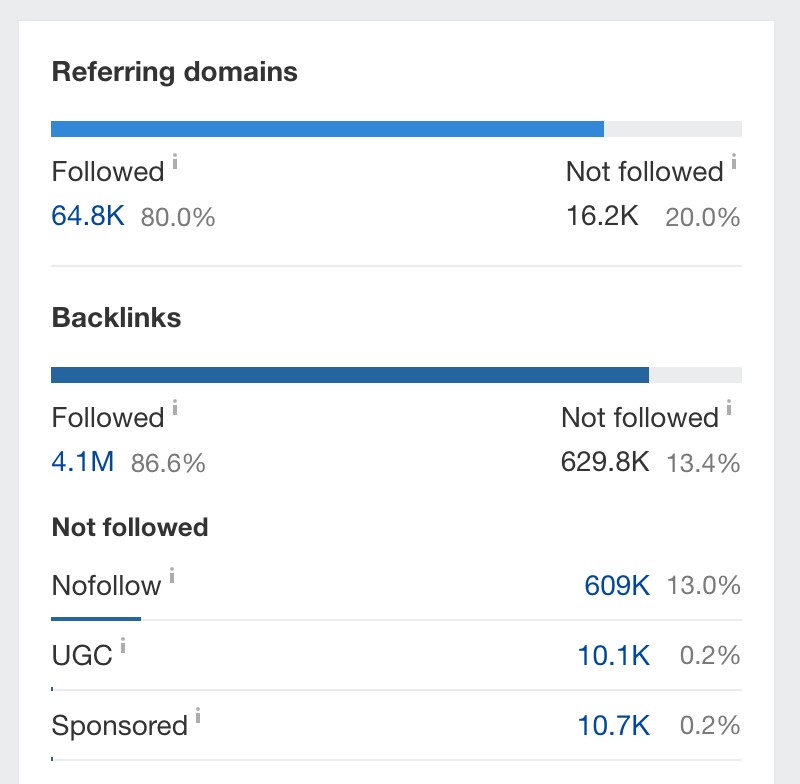
Check the cumulative number of referring domains (unique websites) and backlinks to your competitors’ websites. This allows you to see the quality of the backlinks they’re building.
You can go one step further and analyze the number and percentage of backlinks coming from pages in a given UR (URL Rating) or DR (Domain Rating) range from the URL distribution graph.
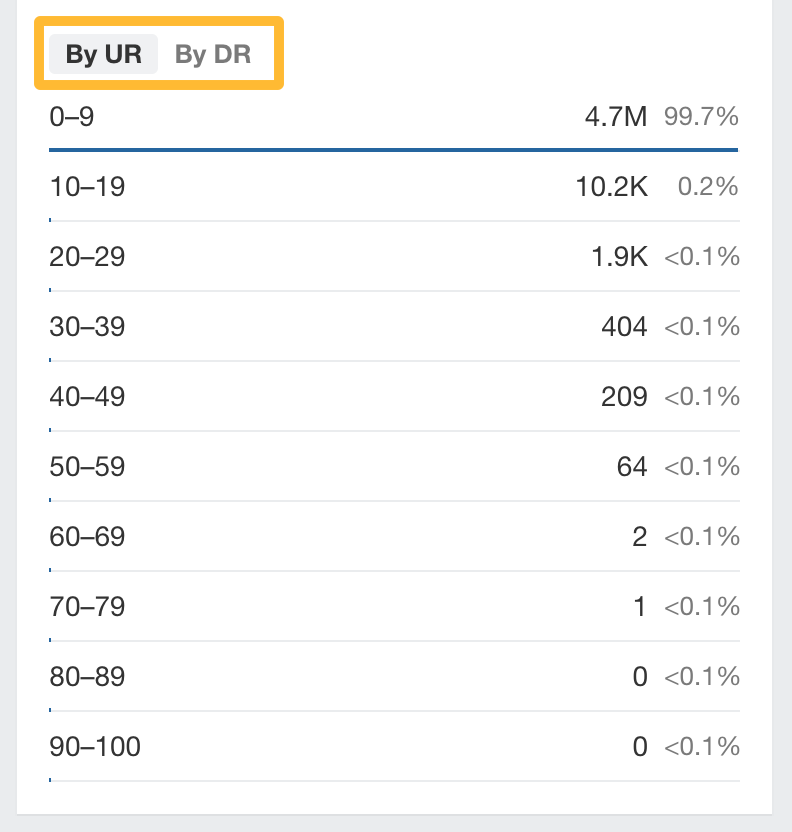
For example, our main website has 4.7 million (99%) of total backlinks coming from websites with a DR 0-9.
DR represents a domain’s backlink strength on a logarithmic scale of 0-100. The closer to 100, the better. Hence, links from a high authority site will be more powerful than a link from a low authority one.